The vast majority of modern field transmitters (both analog and digital) come equipped with a feature known as damping. This feature is essentially a low-pass filter function placed in-line with the signal, reducing the amount of process “noise” reported by the transmitter.
Imagine a pressure transmitter sensing water pressure at the outlet of a large pump. The flow of water exiting a pump tends to be extremely turbulent, and any pressure-sensing device connected to the immediate discharge port of a pump will interpret this turbulence as fluctuations in pressure. This means the pressure signal output by the transmitter will fluctuate as well, causing any indicator or control system connected to that transmitter to register a “noisy” water pressure i.e. repeatedly fluctuating in Pressure signal reading of transmitter.

Such “noise” creates problems with most forms of feedback control loops, since the control system will interpret these rapid fluctuations as real pressure changes requiring corrective action. Although it is possible to configure some control systems to ignore such noise, the best solution is to correct the problem at the source either by relocating the pressure transmitter’s impulse line tap to a place where it does not sense as great an amount of fluid turbulence, or somehow prevent that sensed turbulence from being represented in the transmitter’s signal.
Since this noise is of a much greater frequency than the normal cycles of pressure in a process system, it is relatively easy to reduce the amount of noise in the transmitter signal simply by filtering that electronic signal using a low-pass filter circuit.
The simplest low-pass filter circuit is nothing more than a resistor and capacitor:
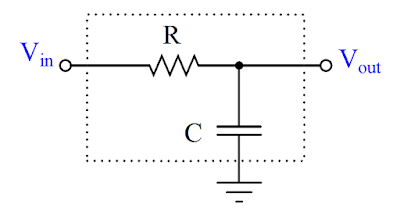
Low-frequency voltage signals applied to this circuit emerge at the output terminal relatively unattenuated, because the reactance of the capacitor is quite large at low frequencies. High-frequency signals applied to the same circuit become attenuated by the capacitor, which tends to “short” those signals to ground with its low reactance to high frequencies. The performance of such a filter circuit is primarily characterized by its cutoff frequency, mathematically defined as f = 1/2πRC . The cutoff frequency is the point at which only 70.7% of the input signal appears at the output (a −3 dB attenuation in voltage).
If successfully applied to a process transmitter, such low-pass filtering has the effect of “quieting” an otherwise noisy signal so only the real process pressure changes are seen, while the effect of turbulence (or whatever else was causing the noise) becomes minimal. In the world of process control, the intentional low-pass filtering of process measurement signals is often referred to as damping because its effect is to “damp” (turn down) the effects of process noise:

In order for damping to be a useful tool for the technician in mitigating measurement noise, it must be adjustable. In the case of the RC filter circuit, the degree of damping (cutoff frequency) may be adjusted by changing the value or either R or C, with R being the easier component to adjust.
In digital transmitters where the damping is performed by a digital algorithm, damping may be adjusted by setting a numerical value in the transmitter’s configuration parameters. In pneumatic transmitters, damping could be implemented by installing viscous elements to the mechanism, or more simply by adding volume to the signal line (e.g. excess tubing length, larger tubing diameter, or even “capacity tanks” connected to the tube for increased volume).
The key question for the technician then becomes, “how much damping should I use?” Insufficient damping will allow too much noise to reach the control system (causing “noisy” trends, indications, and erratic control), while excessive damping will cause the transmitter to understate the significance of sudden (real) process changes. In my experience there is a bad tendency for instrument technicians to apply excessive damping in transmitters. A transmitter with too much damping (i.e. cutoff frequency set too low, or time constant value set too high) causes the trend graph to be very smooth, which at first appears to be a good thing. After all, the whole point of a control system is to hold the process variable tightly to setpoint, so the appearance of a “flat line” process variable trend is enticing indeed. However, the problem with excessive damping is that the transmitter gives a sluggish response to any sudden changes in the real process variable. A dual-trend graph of a pressure transmitter experiencing a sudden increase in process pressure shows this principle, where the undamped transmitter signal is shown in the upper portion and the over-damped signal in the lower portion (please note the vertical offset between these two trends is shown only for your convenience in comparing the two trend shapes):


Comments
Post a Comment